About every eight or nine months the MIT Joint Program on the Science and Policy of Global Change holds a forum where it shares its latest research with the program sponsors and invitees from a variety of academic institutions and government. External presenters from similar institutions are also encouraged. The most recent event was in early June and was a hometown event held in Cambridge, Massachusetts.
The forum was excellent and covered a variety of topics, with a particular focus on water and climate, but the opening talk was of particular interest. In the pre-work for the forum the organizers canvass the invitees and ask if there are any particular subjects that should be included (in an otherwise very full agenda). Several responders (including me) had apparently asked for a better explanation than had given at previous forums of the current hiatus in the global temperature trend. Previous explanations largely relied on the fact that the decadal increase in temperatures remains clear (i.e. each decade was higher than the previous). While this remains true, comparing 1980-1989, 1990-1999 and 2000-2009 rather obscures the fact that not a whole lot has happened in the period 1998-2012.
So MIT took up this challenge and organized an opening lecture on this subject. The talk brought together a number of recent peer-reviewed papers that are starting to show what may well be going on. As I discussed in a previous posting on this topic, the likely culprit is the oceans with a particular focus on the role of ENSO (El Nino Southern Oscillation).
The presenter explained that in addition to the background anthropogenic warming, we would expect to see an enhanced warming signal during El Nino periods (suppressed tropical oceanic heat uptake) and a weakened signal during La Nina periods (enhanced tropical oceanic heat uptake) but the latter also during sulphur rich volcanic eruptions (which produces reflecting aerosols). The series of charts below show monthly variations in the global temperature anomaly (relative to 1951-1980) of the Earth’s surface, from the Climatic Research Unit (CRU, black) and an empirical model (orange, following Kean and Rind 2009) that combines four primary influences and three minor cycles shown in the lower panels.
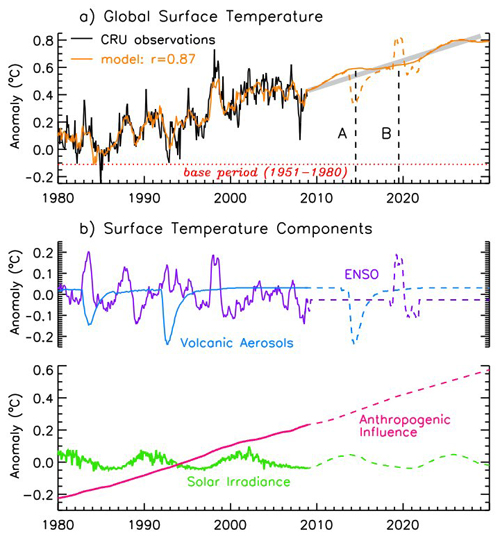
After removing the four primary effects, namely ENSO at three different lags, volcanic aerosols at two different lags, solar irradiance and anthropogenic effects, only minor cycles remain. The resulting chart (shown at the Forum but not one I have been able to locate to reproduce) was essentially a flat line with a minor underlying series of annual, semi-annual and 17 year cycles.
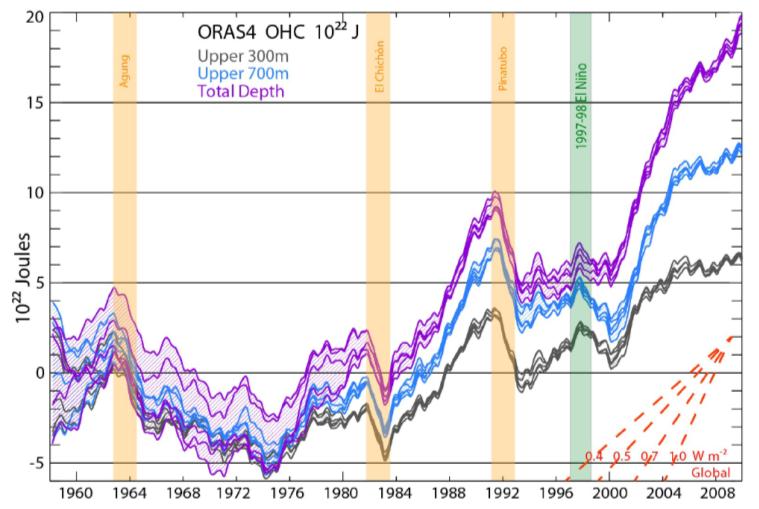
This work sets the scene and similar models have been produced by others, but the presenter also showed further work from a new paper by Balmaseda, Trenberth & Kallen, 2013, which corroborates the ocean uptake story. The presenter noted that since 1998, which is one of the warmest years ever recorded, there has not been a similarly strong El Nino event.
 
Therefore, the vertical mixing in the tropics has not been suppressed much in the last decade and we should therefore see strong ocean warming since 1998. The Balmaseda et. al. paper includes a chart to this effect which shows ocean heat content trends in three ocean layers based on both ship and Argo (ocean temperature sensing drones, started in 2000-2004) temperatures. Linear slopes for various global heating rates (W/m2) are also shown for reference. It should also be noted that a high degree of uncertainty exists with the earlier data.Â
 Â
Â
This was the core of the argument, although subsequent charts noted that there are now multiple indicators of a warming global climate, including humidity, sea level rise, Greenland ice mass decline, snow cover and arctic sea ice extent. One of the members of the audience did note that there had been a recent string of smaller (compared to what is considered big I assume, e.g. Pinatubo) but significant volcanic eruptions over the last decade and that researchers may be underestimating their combined impact.
This conversation will likely run and run, particularly if the current global temperature trend continues to show little sign of warming. It doesn’t take much internet searching to find people who already disagree with the Balmaseda et. al. paper, but that is hardly surprising given the history of this subject.
In any case, this is the story that I heard at a premier even on climate change science and policy organized by the MIT Joint Program.
No comments:
Post a Comment